Decoding Referee Tendency Databases for Precise Soccer Handicap Recalibrations in Midweek Fixtures
Alex Simon · Sep 26, 2026
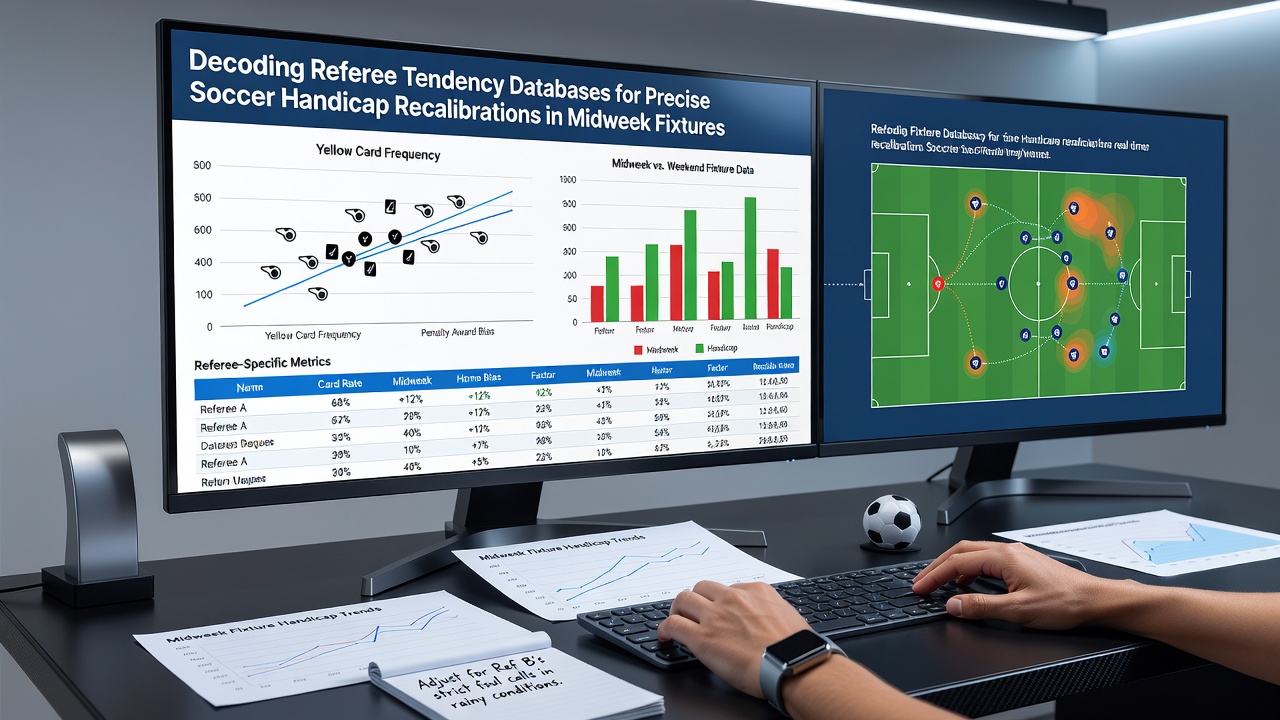
Decoding Referee Tendency Databases for Precise Soccer Handicap Recalibrations in Midweek Fixtures
Referee tendency databases compile detailed statistics on individual officials including average cards issued, penalty awards, foul counts, and stoppage time patterns across thousands of matches. Analysts in September 2026 continue to refine these datasets to adjust handicap lines for midweek fixtures where squad rotations and travel demands alter game dynamics compared to weekend schedules. European domestic leagues and UEFA competitions release referee assignments several days before kickoff allowing teams to recalibrate expected outcomes based on historical referee behavior rather than generic league averages.
Core Components of Referee Databases
Databases track variables such as yellow cards per 90 minutes, red card frequency, and the ratio of home versus away penalties awarded by each referee over multiple seasons. Major European leagues contribute match data to centralized repositories while national federations maintain supplementary records for domestic cup ties. Researchers cross-reference these figures with team-specific metrics including average tackles attempted and disciplinary records to produce adjusted projections for handicap markets. Midweek games often feature expanded benches and younger lineups which can shift foul rates in ways that standard models overlook until referee-specific filters are applied.
Application to Handicap Recalibrations
Handicap recalibrations occur when fresh referee appointments alter projected goal margins or card totals. A referee with an established record of issuing 5.8 cards per game in away fixtures might prompt line movement on over-card markets while simultaneously tightening the spread on a -0.75 handicap if that same official averages fewer than 22 fouls per match. Data from the 2025-2026 campaign shows that midweek UEFA Europa League fixtures produced an average of 0.4 additional cards when the assigned referee had officiated fewer than three games in the prior 14 days. Analysts integrate fatigue indicators with referee profiles to generate updated probability distributions before markets fully incorporate the information.
Midweek Specific Variables
Fixture congestion in September 2026 creates distinct patterns because clubs balance domestic and European obligations. Referees who maintain consistent card rates across high-tempo and low-tempo matches provide stable baselines while others exhibit variance tied to game intensity. Databases now incorporate GPS-derived player workload figures alongside traditional statistics to account for reduced pressing in rotated squads. One study released by a sports analytics group at the University of Loughborough identified a 12 percent drop in total fouls when teams rested three or more starters in midweek compared with their weekend averages.
Integration with External Data Sources
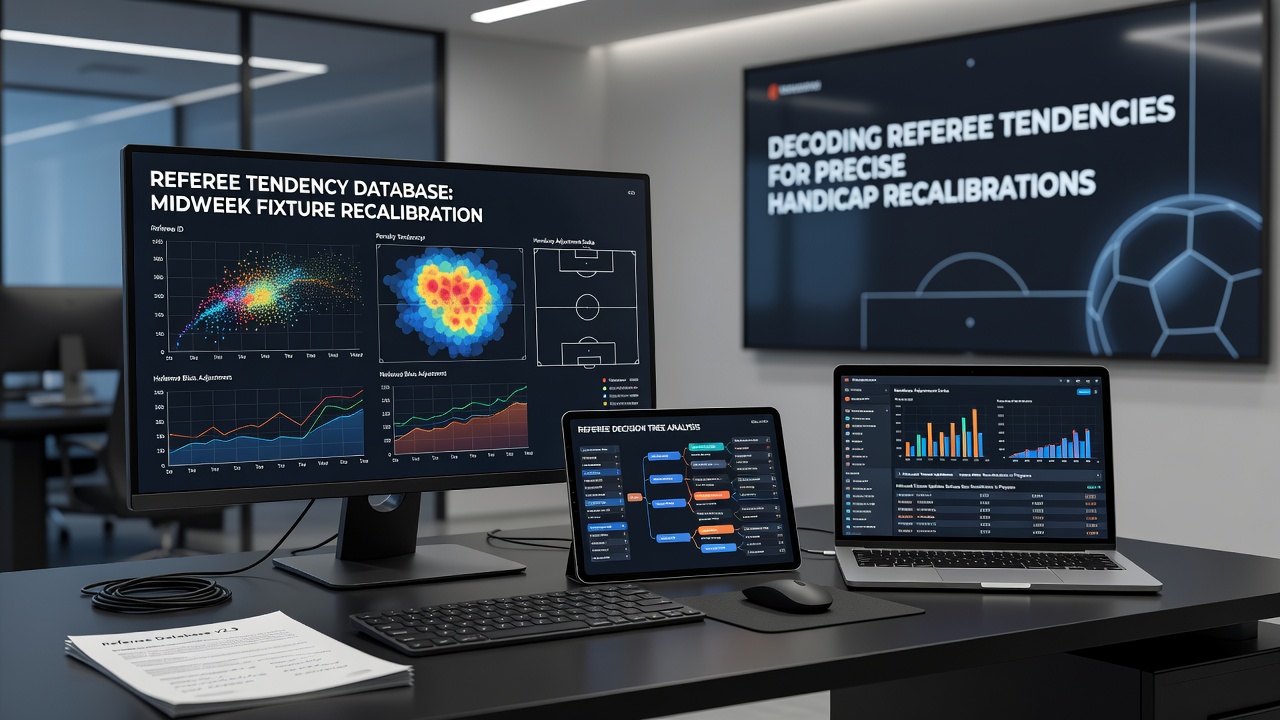
Teams and analysts combine referee databases with injury reports, travel distances, and weather conditions to produce layered recalibrations. UEFA technical reports supply additional context on referee performance across age-group tournaments while the Australian Institute of Sport publishes comparative studies on officiating consistency in different time zones. These inputs help isolate referee effects from situational factors that dominate midweek schedules. Figures released by the German Football Association in early September 2026 indicated that referees averaging more than 28 fouls per game contributed to a measurable increase in stoppage time during Bundesliga midweek rounds.
Practical Recalibration Process
Analysts begin by filtering database entries to matches with similar team motivation levels and competition stages. They then apply regression models that weight recent referee form more heavily than career-long averages because officiating crews undergo annual fitness and rule-update assessments. The resulting adjustments feed into handicap algorithms that output revised lines for both goal and card markets. Observers note that the process requires continuous updating as new match data arrives and referee assignments shift due to scheduling conflicts or fitness issues.
Challenges in Data Interpretation
Referee databases contain noise from subjective decisions that video review systems cannot fully standardize. Midweek fixtures amplify this variability because lower attendance and altered pitch conditions can influence referee positioning and perception of challenges. Researchers therefore apply confidence intervals around projected card totals rather than point estimates when recalibrating lines. Cross-validation against multiple independent databases reduces the risk of overfitting to a single league's reporting conventions.
Conclusion
Referee tendency databases supply structured inputs that support precise handicap recalibrations when midweek fixture demands diverge from weekend norms. Continued expansion of tracking technologies and multi-source data integration allows analysts to isolate referee contributions more accurately across congested schedules. The approach relies on transparent statistical methods and publicly available league records rather than proprietary intuition.