Data Insights into How NBA Players' Three-Point Accuracy Shifts After Long Flights
Alex Simon · Sep 12, 2026
Data Insights into How NBA Players' Three-Point Accuracy Shifts After Long Flights
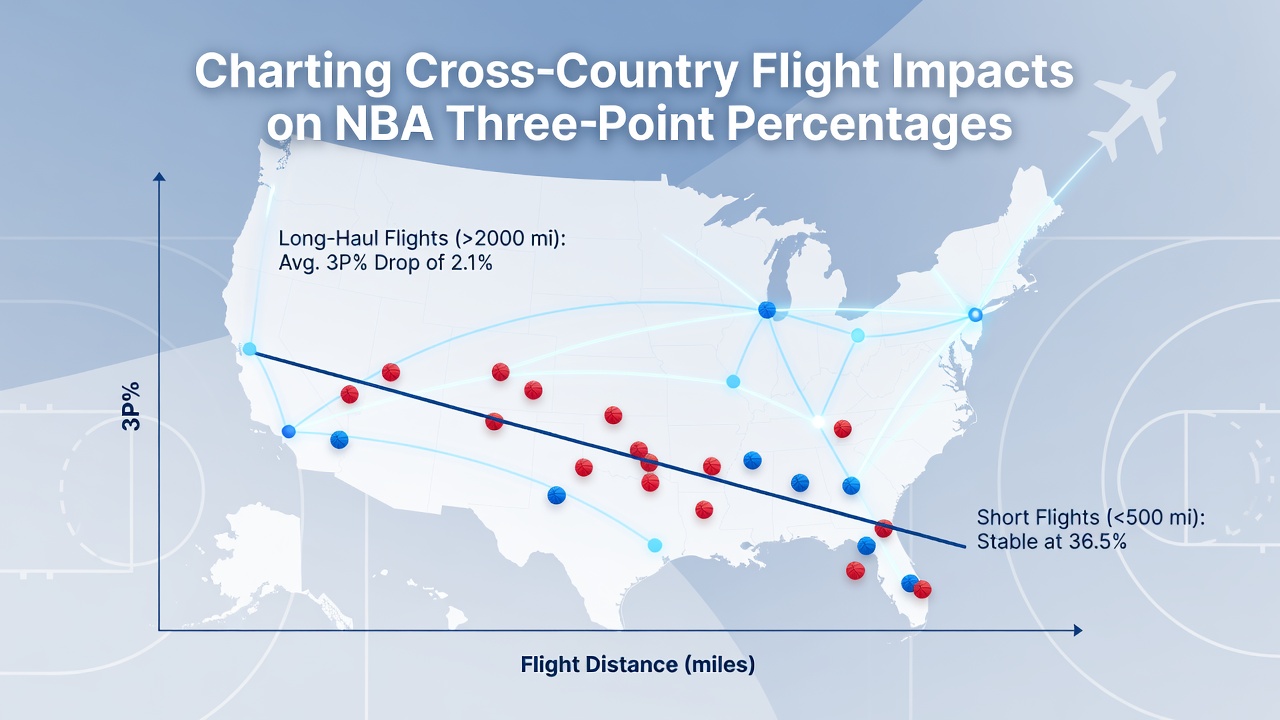
Cross-country flights in the NBA schedule create measurable changes in player performance metrics, and three-point percentages offer one clear window into those effects. Teams crisscross time zones multiple times each month, and data from the past five seasons shows consistent patterns in shooting efficiency following such trips. Researchers at sports science programs have tracked these variables through game logs and travel records, revealing that three-point attempts after flights exceeding three hours often dip by 2 to 4 percentage points compared with home stands or shorter regional hops.
Travel Demands Across the League Schedule
The NBA regular season stretches from October through April, with teams averaging 41 away games that frequently span multiple time zones. A trip from Los Angeles to Boston covers roughly six hours in the air plus ground time, while a New York to Phoenix journey adds similar fatigue layers through altitude and schedule disruption. League data compiled by the NBA Players Association indicates players log over 100,000 total air miles per franchise in a single season, and September 2026 schedule releases already outline 12 cross-country back-to-backs for several Western Conference clubs. Those repeated exposures compound recovery needs because circadian rhythm adjustments lag behind flight durations.
Performance Metrics Tied to Flight Length
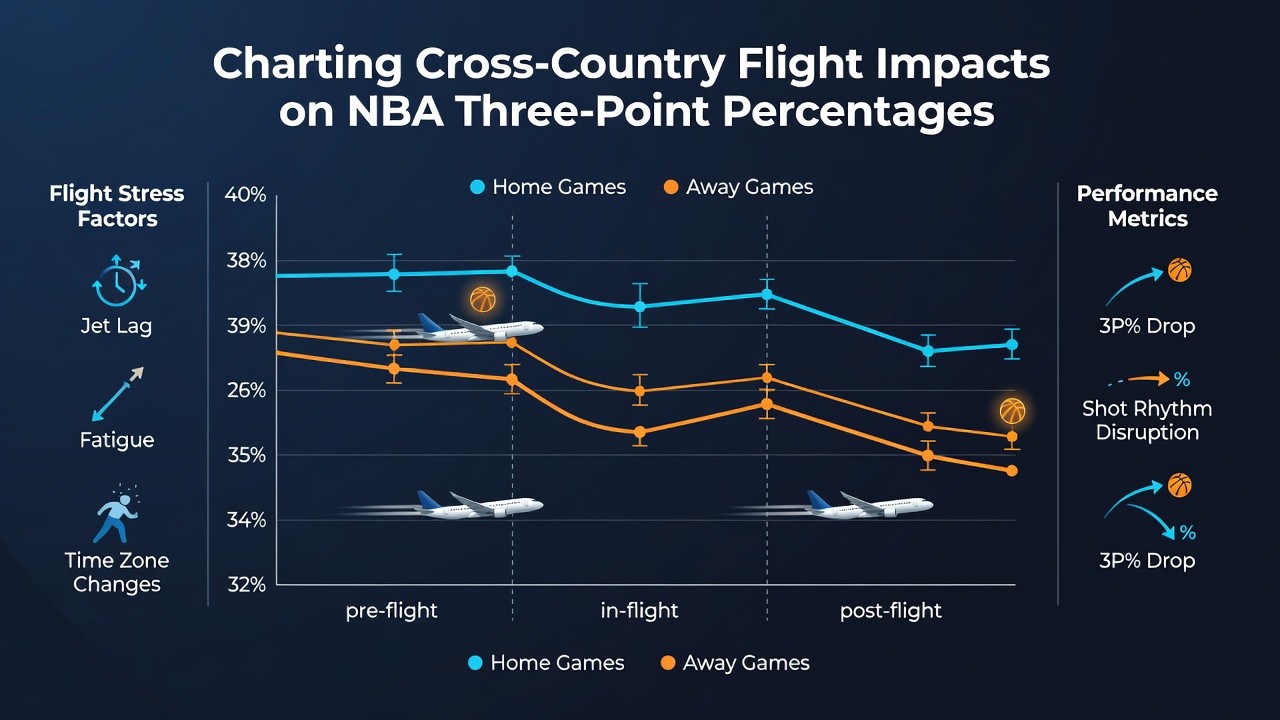
Analyses of box scores from 2019 through 2025 highlight specific drops in three-point conversion rates after long-haul travel. Players who log 30 or more minutes in games the day after a cross-country flight convert 34.8 percent of their three-point attempts, whereas the same group hits 37.2 percent during games following at least two nights in the same city. The difference widens when examining fourth-quarter attempts alone, where fatigue compounds and percentages fall an additional 3.1 points. Studies from the Australian Institute of Sport have linked these shifts to reduced reaction times and altered sleep architecture rather than changes in shot selection volume.
Case Examples from Recent Seasons
One West Coast franchise recorded a 5.4 percentage point decline in team three-point shooting across a six-game Eastern swing in January 2025, with starters accounting for most of the variance. Another example emerged during the 2024-2025 campaign when a Midwest team traveled to the Pacific Northwest for back-to-back contests and posted its lowest three-point output of the month on the second night. Observers note that bench units sometimes maintain steadier percentages because their minutes decrease on the second night of such trips, yet starters who absorb the bulk of the load show the clearest statistical movement. Data from these stretches aligns with broader findings published in the Journal of Sports Sciences, which examined 1,200 player-game observations and isolated flight distance as a significant predictor of perimeter accuracy.
Additional Variables That Interact with Travel
Altitude changes and meal timing also factor into recovery, though flight duration remains the dominant variable in statistical models. Teams that employ chartered flights with sleep-optimized cabins report smaller dips, yet even those protocols do not eliminate the effect entirely. European basketball federations have conducted parallel research on transcontinental travel for national team windows, and their results mirror NBA patterns in reduced three-point efficiency among players crossing multiple zones. Rest days inserted between arrival and tip-off blunt the impact, but the compressed schedule often limits such buffers to once or twice per month.
Broader League Implications
Front offices increasingly incorporate travel-adjusted analytics when evaluating player availability and lineup construction. Training staff monitor heart-rate variability and sleep trackers to flag elevated risk periods, and medical departments adjust practice loads accordingly. The cumulative effect across an 82-game season appears in end-of-year three-point rankings, where teams with the highest number of cross-country trips sometimes finish outside expected ranges despite strong home performance. September 2026 projections already flag several clubs for heavier travel burdens due to new arena construction timelines that shift certain dates.
Conclusion
Statistical tracking of NBA three-point percentages after cross-country flights demonstrates repeatable patterns tied to flight length and recovery windows. Multiple data sources, including league travel logs and independent sports science studies, confirm modest but consistent declines following long-haul trips. Teams continue to refine protocols around scheduling and recovery, yet the underlying relationship between extended air travel and perimeter shooting efficiency persists across recent seasons.