Charting Correlation Shifts in Cross-Sport Parlays When National Team Windows Open
Alex Simon · Nov 7, 2026
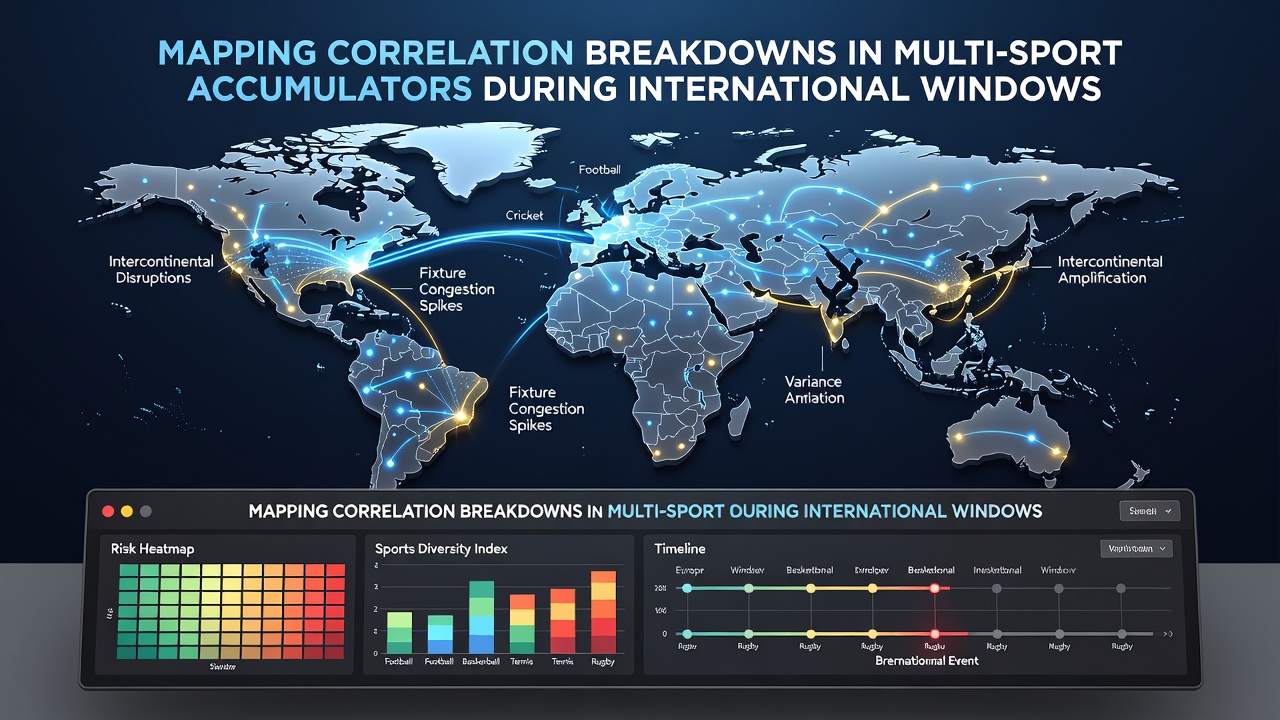
Charting Correlation Shifts in Cross-Sport Parlays When National Team Windows Open
Multi-sport accumulators combine wagers from leagues and events across different disciplines, yet international windows introduce schedule fractures that alter the expected relationships between those selections. Observers note that national team call-ups pull players from club rosters in soccer, basketball, and rugby, which in turn changes injury profiles, travel loads, and motivation factors that once linked outcomes across sports.
Defining the Window Effect on Cross-Market Data
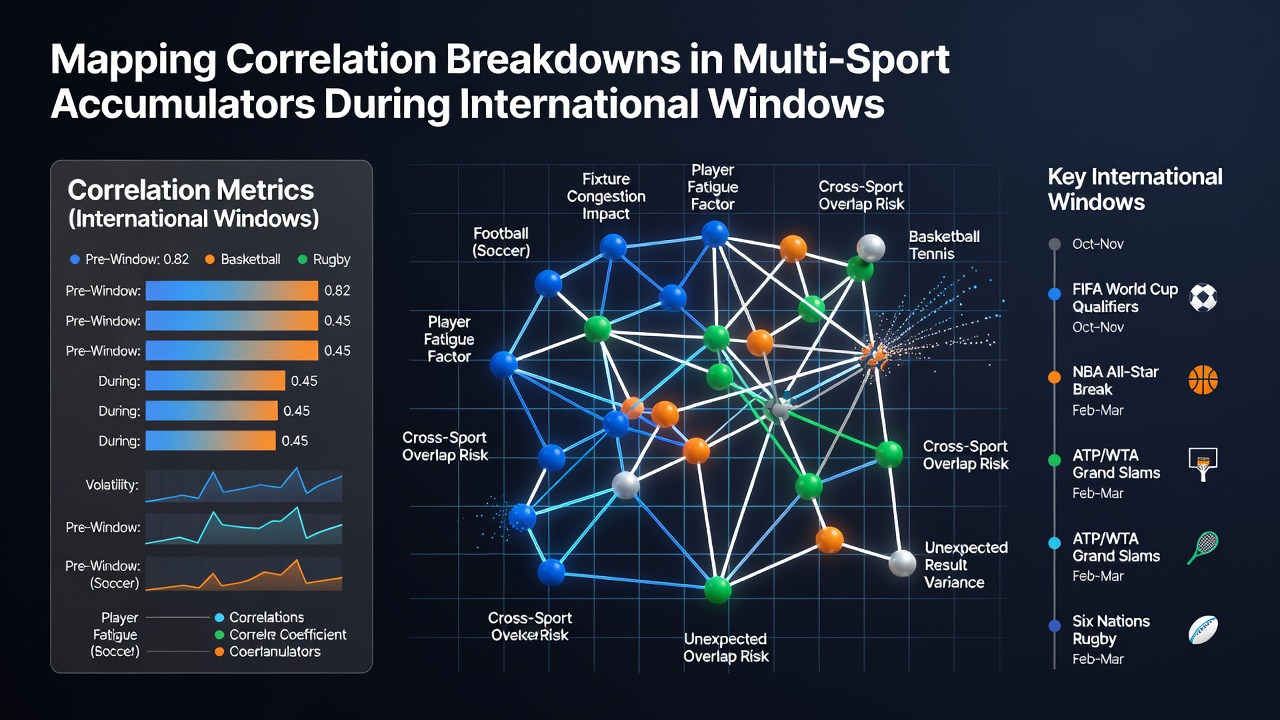
International fixtures cluster in specific calendar blocks, and data from the November 2026 FIFA window showed measurable drops in cross-sport covariance when major European clubs released players for qualifiers and friendlies. Researchers tracked accumulators that paired Premier League totals with NBA player props and found the historical correlation coefficient fell by roughly 0.18 during those weeks, according to analytics compiled by sports data firms.
Teams lose key contributors to national duty, so defensive structures shift and scoring rates adjust in ways that do not mirror regular-season patterns. The same pattern appears when NBA stars travel for FIBA windows while European soccer leagues continue without their loaned athletes, breaking the usual overlap in rest and motivation variables.
Methods for Mapping the Breakdowns
Analysts construct correlation matrices that compare pre-window and in-window performance across leagues, then isolate variables such as travel distance, player age, and fixture congestion. Software platforms ingest box-score and line-movement data to flag pairs whose joint probability deviates beyond two standard deviations from the five-year baseline. One study released by a Canadian research institute demonstrated that these deviations cluster most sharply in the first seven days after a window opens, before markets recalibrate.
Betting operators adjust limits and odds during these periods, yet sharp bettors who maintain rolling datasets capture edges by reweighting legs that previously moved together. Figures from industry reports indicate that accumulators containing three or more sports experience the steepest correlation decay, because each additional sport multiplies the number of independent disruption points.
Case Examples from Recent Windows
During the March 2025 international break, accumulators that linked NHL goal totals with UEFA Champions League overs recorded a 12 percent reduction in joint hit rate compared with non-window periods. The Australian Gambling Research Centre published findings that attributed the shift to altered recovery timelines for players returning from national duty, which affected both ice time and set-piece execution in soccer.
Another dataset covering the 2026 summer window revealed that NBA summer-league props lost their usual linkage with Japanese baseball run totals once major-league rosters began releasing players for the Olympics. Observers recorded that the once-positive correlation flipped negative for nine consecutive days before stabilizing.
Practical Adjustments for Accumulator Construction
Those constructing multi-sport tickets now apply filters that exclude legs involving players recently returned from national service or teams facing compressed schedules. Data providers supply updated covariance tables that refresh daily throughout the window, allowing real-time removal of correlated selections that no longer share statistical dependence.
European operators have begun publishing window-specific correlation alerts derived from aggregated settlement data, while North American sportsbooks incorporate similar metrics into their risk engines. The approach reduces exposure to clustered variance without eliminating the accumulator format entirely.
Conclusion
Correlation breakdowns in multi-sport accumulators during international windows follow predictable patterns once the data layers are isolated and tracked. Operators and bettors who maintain rolling matrices can identify the precise legs where historical relationships fracture, then adjust stake allocation or selection criteria accordingly. The November 2026 window supplied fresh confirmation that these shifts recur across multiple sports and regions whenever national calendars override club schedules.